Appraisal of human characteristics—such as achievement, ability, proficiency, attitude, belief, or another construct—is routinely accomplished through administration of a test, which is itself often carefully developed and administered by standardized protocols. Examinees and other test users are usually interested only in the results yielded by a test administration; generally they are not attuned to characteristics or technical features of the instrument itself. Still, many persons who use test results realize that the usefulness and appropriateness of test-score interpretation is a direct result of the test’s internal characteristics. The internal attributes of a test are technically termed its psychometric properties. Psychometric properties are characteristics of tests and other measures of human characteristics that identify and describe attributes of an instrument, such as its reliability or appropriateness for use in a particular circumstance.
Most commonly, psychometric properties provide information about a test’s appropriateness, meaningfulness, and usefulness—in other words, its validity. As illustration, suppose a test is advertised as a measure useful for diagnosing a personality disorder such as schizophrenia. The test’s psychometric properties provide test makers and users with evidence of whether the instrument performs as portrayed.
Academic Writing, Editing, Proofreading, And Problem Solving Services
Get 10% OFF with 24START discount code
Although numerous psychometric properties exist for describing the technical qualities of tests, they are not catalogued into a convenient, definitive list. Instead, whenever a particular feature of a test is described in terms of scientific standards (i.e., not just mentioned in casual conversation), it may be considered as a psychometric property. In its most general usage, therefore, psychometric property as a scientific term refers to some essential attribute of the test.
Psychometric properties focus on particular features of a test. Some properties provide evidence as to the quality of the whole instrument, while others provide evidence about its constituent parts, its sections, or even its individual items. For example, when looking at a whole test, a psychometric property could indicate whether the instrument measures a single construct or many. The attribute of a test measuring only a single dimension—or more than one dimension if that is the case—is a psychometric property of the complete instrument. Another psychometric property of the whole test could indicate whether the instrument appraises the target construct equally well for women and men. This is a psychometric property of sex (or gender) equality. Still other psychometric properties provide evidence of whether a test measures a construct consistently (i.e., reliability). These examples illustrate some common psychometric properties of an entire test: its dimensionality, its equality, and its reliability.
Psychometric properties also exist for individual test questions (i.e., items). Indicators of a particular test item’s difficulty, its ability to discriminate among people having differing amounts of the construct being measured (i.e., discrimination), and the likelihood that the correct answer could be chosen by guessing are each a psychometric property of an item.
Another feature for psychometric properties is that they are generally—but not exclusively—expressed quantitatively. Often an index, a coefficient, or some other numerical quantity is given to convey the property. Many students and professionals are familiar with a reliability coefficient, for example. The reliability coefficient is a numerical value. “Reliability” is the psychometric feature for the test, but it is expressed as a quantitative value. So, too, most other psychometric properties are indicated numerically. However, a quantitative value is not always the best means of conveying a particular psychometric property. Validity, for instance, is a complex phenomenon that cannot be meaningfully reduced to a single index or value. Validity is the overarching psychometric property, but a thorough discussion that summarizes an extensive body of evidence is necessary to describe test validity.
It is important to investigate and learn about a test’s psychometric properties for two reasons. First, this information is necessary for sound test construction. Psychometricians and other professionals who develop tests need to evaluate and describe how a test functions so that it can be built to a specified level of quality. Second, knowing about the psychometric properties of a test provides evidence that information obtained using the instrument can provide a sound basis for decision making. Psychologists, counselors, educators, policy personnel, and many others often base their decisions, at least in part, on the information garnered from tests. The evidence that supports such decisions is found in a test’s psychometric properties. Without knowing how well a test functions, interpretations are suspect.
Distinguishing Psychometric Properties From Statistics
Psychometric properties are not statistics per se, but they are generally represented by quantitative values. These values are often calculated using statistical procedures. For example, consider more carefully the notion of reliability, which refers to the consistency of measurement. Reliability indicates whether one would obtain consistent information if one applied a testing procedure to a population of individuals or groups on repeated occasions. The idea of how consistently a test operates across several administrations is a psychometric property of a test. A statistical procedure is used to calculate a reliability coefficient or reliability index.
Furthermore, many psychometric properties cannot be expressed through a single value, like a coefficient or index. Many important properties of tests are broad concepts, like their factor structure. Unearthing information about the factor structure of a test typically requires a research design (often a complex design) and information about the factor structure of a test cannot be conveyed by a single value. Thus, statistics are used to calculate values that permit a concise, coherent statement about the psychometric property, but the statistics do not represent the psychometric property. Instead, the concept (e.g., the factor structure for the test) is the psychometric property.
Test Validity and Psychometric Properties
In a very general sense, all psychometric properties are gauges of a test’s validity. Validity refers to the degree to which evidence and theory support the interpretations of test scores. One way to think of validity is to imagine how the scores on a test provide information that is useful, appropriate, and meaningful for a particular decision. A decision that is based on supported evidence is valid, and the test is judged to be valid for that particular decision. All psychometric properties provide information (either directly or indirectly) that indicates the test’s usefulness for making interpretations, and hence all psychometric properties provide information about a test’s validity.
Types of Psychometric Properties
Table 1 lists some common psychometric properties of tests. Note that the table presents both item statistics and test statistics, the two categories for psychometric properties mentioned above. Under Item Statistics the list includes several indicators of psychometric properties, including item difficulty, item discrimination, and item fit statistics. Each of these characteristics of test items is a psychometric property and each can be expressed in multiple ways. Item difficulty, for instance, can be a p value, an item response theory (IRT) fit statistic, or another index not shown in Table 1. The p value is the proportion (percentage) of examinees that responded correctly to the item on a given occasion. The IRT fit statistic provides an indication of the appropriateness of the question for an examinee when the examiner wishes to administer only items that are theoretically suited to each examinee’s overall ability in the proficiency being appraised. Items that are too difficult and those too easy for an examinee are best omitted because they likely provide little information beyond that which can be garnered by presenting only items matched to the examinee’s ability. As indicated in Table 1, a variety of numerical values are available for most psychometric properties, each of which has a unique meaning.
Table 1 also indicates a number of properties (e.g., centrality, dispersion, distribution, and reliability) that pertain to whole tests (see the Test Statistics column).
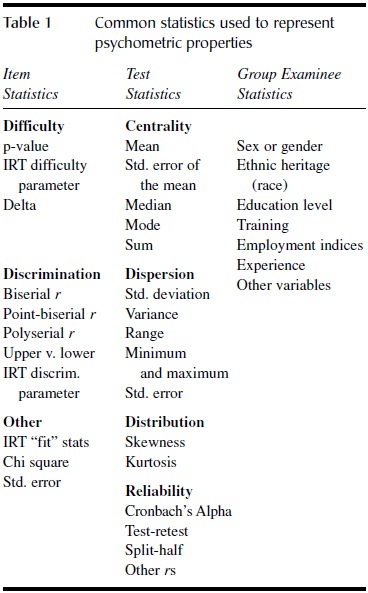
Again, each psychometric property can have a number of expressions. The psychometric property of centrality provides information about the relative status of the population of examinees on the construct being measured. For example, the population of gifted high school students might be expected to have a relatively high mean, median, mode, and sum, and a relatively low standard error of the mean on a test designed to measure readiness for college. Administration of this test to a sample of gifted high school students, therefore, provides an opportunity to determine whether the test yields results that make sense.
The property of dispersion is close to being the opposite of centrality in tests. Dispersion indicates how variable the examinees are on the appraised attribute. A heterogeneous (i.e., highly variable) group will obtain a wide array of scores; a homogeneous (i.e., very similar) group of examinees will obtain scores that differ only by a small amount.
The psychometric property of distribution refers to the distribution of scores relative to a normally distributed population. In a normal population, the distribution of scores around the median is symmetric. That means that each half of the distribution of scores is a mirror image of the other half of the distribution. When graphed, a normal distribution yields a bell-shaped curve, evidencing zero skew. When the scores are not symmetric, the distribution will be either positively skewed (i.e., have too many low scores) or negatively skewed (i.e., have too many high scores). Kurtosis indicates the peaked nature of the distribution. When the population is symmetric, the number of high and low scores matches the number expected and the peak (i.e., kurtosis) is zero. High-peaked distributions have fewer high and low scores than expected and a kurtosis value greater than zero. Low-peaked distributions have more high and low scores than expected and a negative kurtosis value. Reliability has already been discussed.
Psychometric properties are often displayed in a graphic form when the precise values are less important than conveying the meaning of the properties. Figure 1 is an example that displays a Q-Q plot illustrating the psychometric property of normality in a mathematics test. Normality is another type of expression of the normal values explained for Table 1. The base of the plot is the range of scores on the test (i.e., from below 200 to above 400 in Figure 1). These observed values are plotted against a residual value. The residual value is the difference between the observed value and a value that would be expected if the population were perfectly normal. Thus, this figure shows how much the observed values deviate from the values that would occur in a normal population.
To interpret normality in a Q-Q plot, notice how the test values (shown as circles) align themselves with the near-45 degree regression line, going from lower left to upper right. In this figure one can see that low-ability examinees (on the lower left near the starting point of the regression line) are not normally distributed. Most of the examinees at the other ability levels are close to normal. However, another slight deviation from normality occurs for the highly able examinees, shown by the circles deviating from the line at the upper right. In test development work, exploring the property of normality for a group of examinees is a common and exceedingly useful procedure. As can be seen in Figure 1, graphic displays of information about psychometric properties often provide clear interpretations of the essential point by eliminating the complexity that occurs when the statistical values are reported in detail.
Figure 1 Graphic illustrating the psychometric property of normality
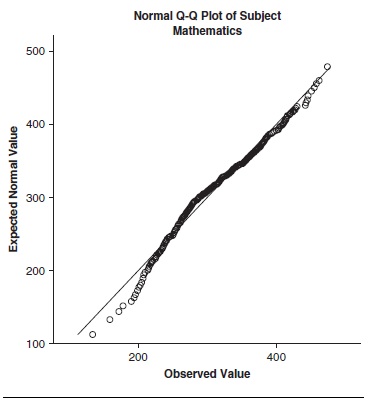
Figure 2 illustrates a more complicated graphic that conveys a myriad of technical information about a test. The curve line in Figure 2 represents the pattern of responses of a population of examinees to one test item. The lower axis, known as the x axis or the abscissa, is labeled “Ability” and its scale is symmetric around zero. In other words, a zero on this scale is the median ability of the examinee group. The median is the central value; half of the examinees scored higher than the median and half scored lower than the median. The numeric values to the left and right represent standard deviations from the median. Examinees at -3.0 scored very low on the ability being measured and those at +3.0 scored quite high on the ability being measured. The vertical scale on the left, known as the y axis or the ordinate, ranges from 0.0 to 1.0. This dimension indicates the probability an examinee of that ability level will make a correct response to the item. As can be seen, the probability of a correct response ranges from 0% (0.0) to 100% (1.0). The curved trace line for the item illustrates that persons of low ability have only a low probability of responding correctly to the item. As ability increases, however (moving from left to right along the x axis), the probability of a correct response to the item grows correspondingly.
Figure 2
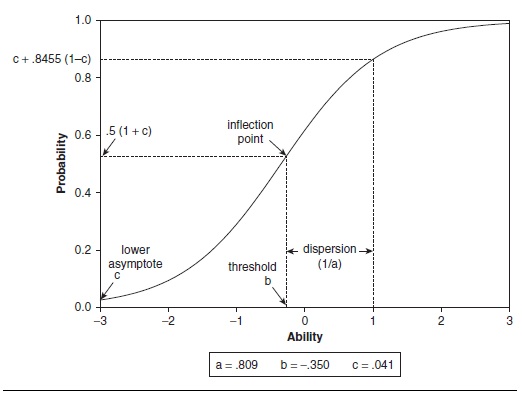
Item Characteristic Curve showing the relation of item difficulty to item discrimination across the full range of ability levels.
Source: Osterlind, S. J. (2006). Modern measurement: Theory, principles, and applications of mental appraisal. Upper Saddle River, NJ: Prentice Hall.
Figure 2 also illustrates that the growth is not perfectly linear. If the growth were perfectly linear, the item trace line would be at a 45-degree angle. Instead, the lazy S-shape line illustrates that at very low and very high ability levels, the curve begins to flatten out. That shows that persons in those low and high ability groups all have about the same probability or responding correctly to the item. Thus, the curve tells users that the item is good for distinguishing among people of differing ability levels provided they do not fall into the very high or very low ability group (i.e., their ability is between -1.5 and +1.5 standard deviations from the median). The item is not very useful for distinguishing among people at the lowest and highest ability levels. Still, the overall figure does provide a useful illustration of displaying multipart and refined psychometric properties for tests and their items.
Although Figure 2 contains more psychometric information than can be conveniently explained here, the point to garner from this figure is a realization that psychometric properties are often complex and represent sophisticated concepts, but sometimes they can be represented clearly and simply using graphical displays.
Evaluation
Psychologists use tests in research and practice to measure constructs that are not readily observable (e.g., agreeableness, need for cognition, and empathy). The scores yielded by a test often provide a basis upon which psychologists make decisions. Because of the importance of test data, it is essential to evaluate the psychometric properties of the instruments psychologists use. The internal properties of the instruments that psychologists use are known as their psychometric properties. An evaluation of the psychometric properties of an instrument allows psychologists to use the instrument with confidence that it will provide reliable, valid, meaningful information that can be used in making decisions.
References:
- American Educational Research Association, American Psychological Association, National Council on Measurement in Education. (1999). Standards for educational and psychological testing. Washington, DC: American Educational Research Association.
- Brennan, R. L. (Ed.). (2006). Educational measurement (4th ed.). Westport, CT: Praeger.
- Embretson, S. E., & Reise, S. P. (2000). Item response theory for psychologists. Mahwah, NJ: Lawrence Erlbaum.
- Hambleton, R. K., Robin, F., & Xing, D. (2000). Item response models for the analysis of educational and a psychological test data. In H. E. A. Tinsley & S. D. Brown (Eds.), Handbook of applied multivariate statistics and mathematical modeling (pp. 553-581). San Diego, CA: Academic Press.
- Marcoulides, G. A. (2000). Generalizability theory. In H. E. A. Tinsley & S. D. Brown (Eds.), Handbook of applied multivariate statistics and mathematical modeling (pp. 527-551). San Diego, CA: Academic Press.
- Osterlind, S. J. (2006). Modern measurement: Theory, principles, and applications of mental appraisal. Upper Saddle River, NJ: Prentice Hall.
- Rao, C. R., & Sinharay, S. (Eds.). (2007). Handbook of statistics, 26: Psychometrics (Vol. 26). Oxford, UK: Elsevier.
- Thorndike, R. M. (2005). Measurement and evaluation in psychology and education (7th ed.). Columbus, OH: Merrill.
- Tinsley, H. E. A. (1992). Psychometric theory and counseling psychology research. In S. D. Brown & R. W. Lent (Eds.), Handbook of counseling psychology (2nd ed., pp. 37-70). New York: Wiley.
- van der Linden, W. J., & Hambleton, R. K. (Eds.). (1997). Handbook of modern item response theory. New York: Springer.
See also: