Life expectancy is the average number of years remaining to an individual of a specified age if the mortality conditions implied by a particular period (cross-sectional) or cohort (longitudinal) life table applied; the former projects the years remaining to all people of a given age, and the latter projects years remaining to all people born in a given year. Life expectancy is widely used as an indicator of mortality conditions because it is based on the mortality experience at all ages and is independent of age structure.
The conventional demographic notation used for life expectancy is ex, which denotes the remaining expectation of life at age x. For example, e0, e50, and e85 refer to the average number of years remaining to people 0 (newborn), 50, and 85 years of age, respectively. Life expectancy at birth (e0) is the most widely used value, so that where life expectancy is referred to without qualification, the value at birth is normally assumed. High levels of infant mortality may mean that those who survive this high-risk year may have higher life expectancies than the newborns themselves. The inverse of life expectancy at birth (1/e0) gives the per capita death rate in a population. For example, the 80-year life expectancy at birth of contemporary U.S. females implies a per capita annual death rate of 0.0125 (1/80).
Academic Writing, Editing, Proofreading, And Problem Solving Services
Get 10% OFF with 24START discount code
The increase in life expectancy can be illustrated by data for women in the United States as given in Table 1, which shows the range of life expectancies at birth as well as at middle and old age over a single century in the United States.
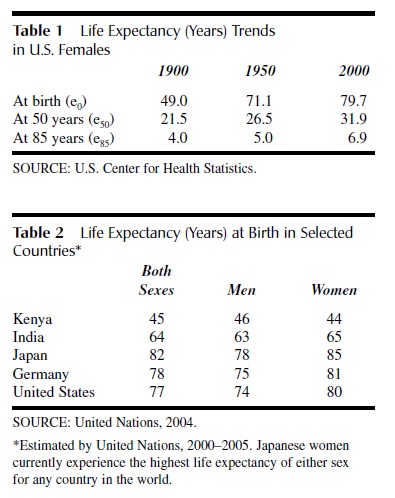
Women enjoy life expectancies 2 to 10 years longer than men in most countries, the difference of which is referred to as the life expectancy gender gap. The life expectancy at birth in less developed countries (e.g., Kenya, India) generally is lower than in developed countries (e.g., Japan, Germany, the United States), as shown in Table 2. Japanese women currently experience the highest life expectancy of either sex for any country in the world.
Life expectancy at age 65 is important in the context of social security (Table 3) because it gives the average number of years the average individual will be expected to collect (unreduced) retirement benefits. For example, men attaining 65 in 2000 can expect to live 16.2 years, compared with 12.7 years in 1940. Thus, the increase in time that men can anticipate receiving social security in 2000 relative to 1940 is 3.5 years.
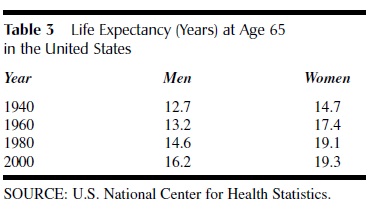 Table 3 Life Expectancy (Years) at Age 65 in the United States
Whereas life expectancy at birth is a life-table measure that refers to the average number of years remaining to a newborn or the average age of death in the cohort, median survival refers to the ages at which half of all deaths have occurred, and the mode of survival refers to the age corresponding to the highest frequency of deaths. For example, the mean, median, and modal ages of death for newborn U.S. females in 2000 were 80, 83, and 88 years, respectively. In every population on record, the mode of the length of life is several years higher than the mean, which is pulled down by premature (early) deaths. An additional concept that is important to understand for context is life span, defined in both empirical and theoretical contexts, the former as the “record age” of a species (122.5 years in humans) and the latter as the “hypothetical upper age limit of a species under a specified set of conditions.”
References:
- Berkeley Mortality Database, http://www.cdc.gov/nchs/fastats/lifehtm
- Carey, R. (2003). Longevity: The biology and demography of life span. Princeton, NJ: Princeton University Press.
- Guillot, M. (2003). Life tables. In P. Demeny & G. McNicoll (Eds.), Encyclopedia of population (V 1, pp. 594–602). New York: The Gale Group.
- Preston, S. , Heuveline, P., & Guillot, M. (2001).Demography: Measuring and modeling population processes. Malden, MA: Blackwell.
- Social Security Administration, http://www.ssa.gov/history/lifeehtml
- S. National Center for Health Statistics, http://www.cdc.gov/nchs/fastats/lifexpec.htm