Item response theory (IRT), also called latent trait theory, is a psychometric theory that was created to better understand how individuals respond to individual items on psychological and educational tests. The underlying theory is built around a series of mathematical formulas that have parameters that need to be estimated using complex statistical algorithms. These parameters relate to properties of individual items and characteristics of individual respondents. The term latent trait is used to describe IRT in that characteristics of individuals cannot be directly observed; they must be inferred by using certain assumptions about the response process that help estimate these parameters.
Item response theory complements and contrasts classical test theory (CTT), which is the predominant psychometric theory taught in undergraduate and graduate programs. Classical test theory differs from IRT in several ways that will be discussed throughout this entry. In general, though, IRT can be thought of as analogous to an electron microscope for item analysis, whereas CTT would be more like a traditional optical microscope. Both techniques are useful for their own purposes. Just like the electron microscope, IRT provides powerful measurement analysis; IRT is useful if you have a need for specific, precise analysis. On the other hand, CTT can be just as useful as IRT when the research questions are vague and general. In medical research, sometimes the optical microscope is preferred to the electron microscope. Likewise, CTT may be preferred in some situations.
Academic Writing, Editing, Proofreading, And Problem Solving Services
Get 10% OFF with 24START discount code
The Item Response Function
Item response theory relates characteristics of items and characteristics of individuals to the probability of affirming, endorsing, or correctly answering individual items. The cornerstone of IRT is the item response function (IRF), which is the graphical representation of a mathematical formula that relates the probability of affirming item i with the value of a latent trait, 6. Figure 1 presents a graphical representation of a hypothetical IRF.
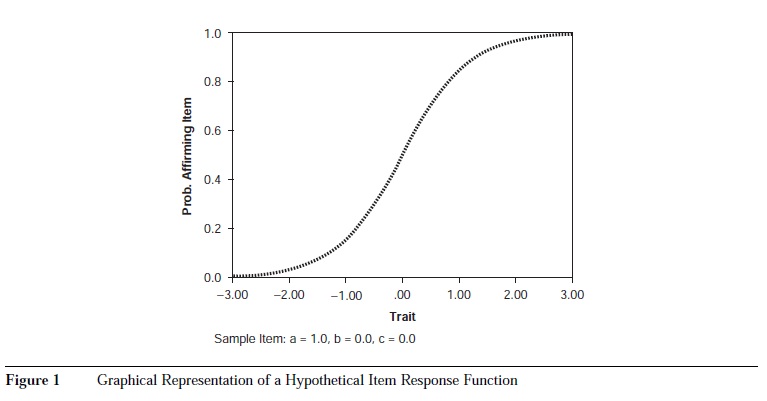
In Figure 1, the x-axis relates to the level of the characteristic being measured by the test. This trait, 6, is typically scored like a z score, with scores at zero being average and scores above zero being above average; scores below zero are below average. Typical 6 distributions range from -3 to +3. The /-axis relates to the probability of affirming an item. For ability items, the /-axis measures the probability of answering an item correctly. For items without correct answers (e.g., attitude or personality items), the /-axis refers to the probability of choosing the keyed option (i.e., the option that taps high conscientiousness). The IRF relates the level of 6 with probability of affirming the item. As can be seen in Figure 1, as 6 increases, the probability of affirming the item also increases. This property of monotonicity is common with IRT models. As can be seen in Figure 1, an individual with a 6 = 0 would have an expected probability of affirming the item of roughly 50%. The corresponding probabilities for a person of 6 = -3 and 6 = +3 are roughly 0% and 100%, respectively.
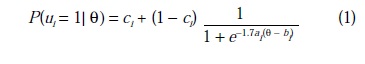
There are many different forms of the IRF. For dichotomously scored items (e.g., right versus wrong or true versus false), the two-parameter logistic model (2PL) and the three-parameter logistic model (3PL) are commonly used. The formula for the 3PL model is
where the probability that a person with a latent trait, 6, affirms an item i (i.e., ui = 1) is a function of three parameters: a, a discrimination parameter; b, a location parameter; and c, a pseudo-guessing parameter. The probability of affirming items with large a parameters varies sharply as a function of 6, whereas the probability of affirming items with low a parameters varies weakly as a function of 6. Mathematically, the a parameter determines the slope of the IRF at its most discriminating point. Items with low a parameters are generally considered poor, undiscriminating items. Items with large, positive b parameters will be endorsed only by respondents with large, positive 6s, whereas items with large, negative b parameters will be endorsed by everyone except people with the most extreme negative 6s. With ability tests, items with large positive b parameters are judged to be difficult, whereas those items with large negative b parameters are judged to be easy. With items that do not have correct answers, the b parameter is often called a location or threshold parameter. The c parameter introduces a nonzero lower asymptote to the IRF so that respondents with large negative 6s will have a nonzero probability of affirming the item; this nonzero asymptote may result from guessing or other processes.
The 2PL formula is a submodel of the 3PL and can be obtained by setting the c parameter to zero. This model has the implicit assumption that people with the lowest 6 values will have a zero probability of affirming the item. The 2PL model is useful in situations, such as personality measurement in a research setting, in which there should be little or no guessing involved. An even simpler model, the Rasch model, is obtained by setting the a parameter to be constant across all items. Each of these models assumes that each item is measuring only one 6 dimension. In general, it is best to choose the simplest model (i.e., the one with fewest parameters), given the typical sample sizes that industrial-organizational psychologists face. Simpler models make the most efficient use of data. By plotting the IRFs, researchers can compare the functioning of items, determine the extent of guessing, and determine the range of 6 that the item is most discriminating.
Other, more complex models exist to measure more complicated types of data. Polytomous IRT models can be used to model data that have more than two scored options. These models replace the IRFs with option response functions (ORFs). Instead of characterizing an item with just one function, an item, as modeled with a polytomous IRT model, has an ORF for each option. Therefore, a five-option item would have five different ORFs. With ORFs, the x-axis still measures 6, whereas the y-axis then becomes the probability of choosing each particular option. There are different polytomous IRT models that have differing assumptions. Some models work with ordinal data, and assume that option 1 has a more negative threshold than does option 2, which in turn has a more negative threshold than does option 3. This assumption would be appropriate for Likert-scale-type data. Other, more flexible models do not make assumptions about the ordering of options. These models might be more appropriate in cases, such as multiple-choice exams, in which it would be difficult to determine a priori the rank ordering of options. Besides polytomous IRT models, other models exist that allow for nonmonotonic functions, as well as for multiple dimensions of 6 to affect responses. New IRT models are introduced on a frequent basis. Often, however, newer complex models are difficult to estimate without prohibitively large data sets.
Applications of Item Response Theory
Item response theory has had a significant impact in psychology by allowing for more precise methods of assessing properties of tests compared with classical test theory. In addition, IRT has had a big impact on psychology by making possible several tools that would be difficult to create without IRT. Psychometric applications, such as computerized adaptive testing, detecting item bias, equating tests, and identifying aberrant individuals, have been greatly improved with the development of IRT. In particular, computerized adaptive testing merits additional discussion.
Computer adaptive tests work by choosing items that are best suited for identifying the precise level of 6 for an individual respondent. Specially, there is an IRT concept called information that is important for adaptive tests. Item-level information is related to the amount of uncertainty about a 6 estimate that can be reduced by administering that item. Information differs by the level of 6. Some items will have high information for low levels of 6, whereas other items may have high levels of information for high levels of 6. Imagine a mathematics test. A basic algebra item may provide high amounts of information for people who possess extremely low ability. That same item, however, would do little to differentiate between individuals of moderate and high math ability. To differentiate between those individuals, a more complex item would need to be given. Information functions can be plotted for individual items (or for tests) to see for what level of 6 the item is best suited.
Computerized adaptive tests work by choosing items that have large amounts of information for the respondent’s estimated 6. Theta estimates are revised after each item response, and then a computer algorithm selects the next item to present based on the information level of items at the revised theta estimate. By choosing only items with large amounts of information, adaptive tests can maintain measurement precision at the levels of conventional tests even though fewer items are administered.
Item response theory has already had a major effect on educational testing through its impact on computerized adaptive testing (CAT). In the 1990s, Educational Testing Service implemented a CAT version of the Graduate Record Examination (GRE). The success of adaptive testing would not be possible without development of IRT. Large-scale adaptive testing would not be possible using CTT.
In the future it is likely that item response theory will yield progress, not only in improvement of measurement technologies but also by making contributions in substantive areas, such as decision-making theory. Graduate students, researchers, and practitioners who are interested in psychological measurement should invest some time to learn more about IRT technology. Computer programs, such as BILOG, MULTILOG, and PARSCALE, are available to conduct IRT analyses.
References:
- Embretson, S. E., & Reise, S. P. (2000). Item response theory for psychologists. Mahwah, NJ: Lawrence Erlbaum.
- Zickar, M. J. (1998). Modeling item-level data with item response theory. Current Directions in Psychology, 7, 104-109.